

Creating truly great content can often be a time consuming and expensive exercise and, as with any marketing activity, there should be a measurable return. Whether you are working in-house or agency-side, one of the questions you will (or should be) consistently be asked about is what affect adding additional content will have on a site. While it is an understandable question, it is often difficult to quantify an answer for, especially before implementation.
A conversation with an in-house friend, @finjg, some time ago got me thinking about the Analytics footprint of different types of content. Essentially, could you use historic data to predict future performance of new content? The short answer is yes, but it is not as easy as it sounds!
At this point I should probably point out that this is very time consuming and I am yet to find any shortcuts (please add them to the comments if you can think of any)!
Categorising Content
The first step you have to take is to categorise your current content by common themes and styles. I am going to use a theoretical marketing blog, but this approach should work with any content you have analytics for. I would generally pick a time period, say the last couple of years (or further back if you have some data that is representative).
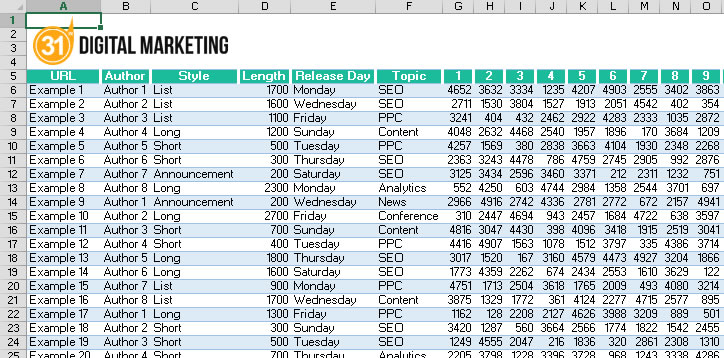
I would categorise the blog posts in the following ways:
- Author – in a lot of industries the author of content can have a big impact on performance, for example, if Rand and I released the same piece of content on the same day I dare say his content would do better (maybe Google have something with this authorship stuff after all)!
- Style – was it a list, long form, short form, announcement, etc.
- Length – round to the nearest 100, to do this in Excel use =round(Cell Reference,-2)
- Release day – this is a pain as it requires a bit of looking up dates
- Topic – this could be SEO, PPC, etc. as well as breaking news and stuff conference coverage
If you wanted to take this further you could also start to look at the way the content is promoted or where on the site it is featured, but I would try and leave the categories as generic as possible otherwise the sample size is unlikely to significant enough to draw reliable conclusions.
Zeroing the Data
Once you have categorised the posts, you need to zero the data (i.e. get all the data to have values start in the same column no matter when they were published). You need to create a spreadsheet where column A has the post URL and then each following columns have the performance of that page per day since it was published (you could do week or month if you really wanted to). So for all URLs column B is the first day’s performance rather than a zero. This is the massively time consuming part – I literally went through page by page on the “All Pages” report exporting the graph data for each and then combining them into a single spreadsheet.
You will have varying amount of data for each URL depending on when it was published and so you need to decide what period you want to look at. I would do this based on the period you are trying to create a content plan for, I like to do a three month period and so I would have data for roughly the first 90 days after publication.
At this point you should start to see the characteristics of different types of posts in the performance. Some styles will have a massive peak the day they are released and then almost immediately performance will tail off, whereas other styles may have a smaller peak, but continue to drive traffic for a long period. I even discovered that the release day for one style of post was not its best performing day, that was usually two days later.
Adding Categories and Graphing Performance
At this point I like to add in the category information. If you want to keep things really simple you can give them each a single category and then create an average performance chart from this. If you want to take it a bit further, and let’s face it if you have come this far then you probably do want to, the way I would suggest to do this is to have a column for each attribute and do either a yes/no or pick from a set list and then create a pivot chart. This means that you will be able to interrogate the data in a load of different ways.
Be warned though, this can be quite time consuming to setup, but you should only have to do it once.
Determine the Curve
Now you have your pivot data up and running it is then time to start playing with the data. At this point you should really get to see some very distinct patterns in the characteristics of each style of post. What is even better is that you can play with different combinations to find which ones are likely to be most effective or have the characteristics you will need.
With blogs I have found you tend to see the following patterns:
- The slow burn – This is a post that will send you traffic for a long period. There won’t be a massive spike, but at the same time the traffic will never dry up. I have seen posts still driving traffic after four years and in some cases the traffic increases over time. This pattern also usually indicates the post is ranking well for something. An example of this kind of post could be “tips on how to pass the AdWords exam”. This is going to be something that people are constantly searching for and largely timeless.
- The flash in the pan/breaking news – The other end of the scale is the post that peaks and then the traffic all but disappears in the space of a few days or a week. Commonly this may be covering something topical which changes quickly or it hits the news results for a keyword and then disappears as more people write on the subject. I once wrote a post on (not provided) the day it first appeared which appeared in the news section for the keywords (not provided) and Google Analytics. It drove loads of traffic for a couple of days and then as the story developed it died off.
- The all-rounder – This is a typical blog post footprint. It will get a good spike for a couple of days to a week and then it will slowly tail off over time as the more people consume it or it paginates on your blog. This will consistently send a handful of visits almost endlessly.
- The cycle/seasonal curve – This could be a post on Christmas trends or commentary on the release of an annual report, it will be relevant for a few weeks or months and then disappear for another year, before coming back again.
- The flop/the niche – Let’s face it, sometimes posts are just plain rubbish or they are only ever going to appeal to a small audience. They start low and continue low.
- The star – This is the holy grail of footprints. The timeless piece of content that is just as relevant today as it was when it was published. This is nigh on impossible to achieve. The best example I could think for this style of footprint would be something like the Moz guide to SEO. I would imagine this still drives similar traffic now as when it was first published.
- The viral – The kind of post which starts small and then explodes. It may get a plug from the right person or it may just connect.
The top four post footprints are the most common and are relatively easy to predict, these are the ones you should be basing your planning on.
Creating the Content Plan
Now you know how different content will perform you have to take into account what you’re trying to achieve in the period.
If for example you want to build an audience you will want to create a lot of slow burn pieces which will keep driving traffic, there is no point in having to renew your audience over and over. Conversely, there is no point creating a load of slow burn pieces if you need all your traffic by a certain period, for example a product launch or by the end of an offer.
In order to make an effective plan there are a few things you will need to know, these will most likely include:
- Availability of resources/authors
- Lead times on content
- Key dates or events in the period
- Publishing schedule
- Any KPIs in place
You then need to focus on key dates or KPIs and work backwards. Remember that you won’t get all of the traffic in the period unless you’re churning out loads of pan flash pieces, but the slow burn stuff will continue to provide traffic into the next period.
To give you an example, if I am trying to hit a certain number of visits in a period, I would usually schedule any cyclical content in first as you know this content is going to perform. I would then focus on some slow burn/all-rounder pieces earlier on in the period. At this point I am looking for potential star pieces, what are the combinations that are most likely to result in a hit (for example, the most popular writer creating a piece on a topic in which most of their regular audience will be interested on the day they are most effective). I will then look for some good solid all-rounder combinations throughout the period. Finally, I will make sure I have some resources for the flashes. It’s not always possible to predict when news will break, but having go-to writers on different topics you know can get a piece out the same day will mean you can capitalise when they do happen.
This sort of plan is all pretty standard, but the difference is because you know what the likely performance of the content will be, you can predict likely performance at the start of the period. You can also track where you performance should be and reassess the plan at certain points in the period so you don’t get to the last week and realise you’re way off target.
Optional Steps
In my example spreadsheet I have created tabs for Content Performance Templates and Period Performance to help with the planning. What I like to do is create standard styles and their 90 day performance (using the pivot table data) and then copy them into the Content Performance Template tab. This gives you a number of default templates of performance.
Once I have done these, I then use them in the Period Performance sheet and paste them in when they are likely to be published and remove any days which go out of the period from the end. This then gives me an estimated daily traffic figure I can track performance against (by copying in actual Analytics data).

Taking it Further – Content ROI
If you want to take this even further then you can start to build in traffic value calculations. If you assign a value to visits by post type, you can give each post/period/writer an overall assumed value and then use that to assess the ROI.
Other Uses – Assessing the Quality of Content or Writers
As well as a valuable planning tool, you can also use the footprints to assess the quality of individual pieces of content or even writers. Simply chart performance against what is considered the standard footprint of content and see if they are above or below the line.
Things to take into Account
There are some things that you will need to take into account when using this method for planning, these include:
- Limitations in the data – those keen on statistics will no doubt point out that you will probably need a fairly large data sample to be able to draw accurate conclusions for likely performance.
- Historic performance doesn’t always indicate future performance – there is no guarantee that historic performance will be repeated.
- The quality of the content will always be the unknown factor – just because content has certain attributes it doesn’t mean it is good.
While it is good to be aware of these limitations, this is meant to act as a guide/forecasting tool. Whatever data you have is better than basing it purely on guesswork.
Fancy giving it a go? I have provided a copy of the spreadsheet I used to create the pivots below (the graph looks a bit odd as all the data is randomly generated). If you can think of any ways to speed up the process or any different ways to analyse the data please add them to the comments section below.